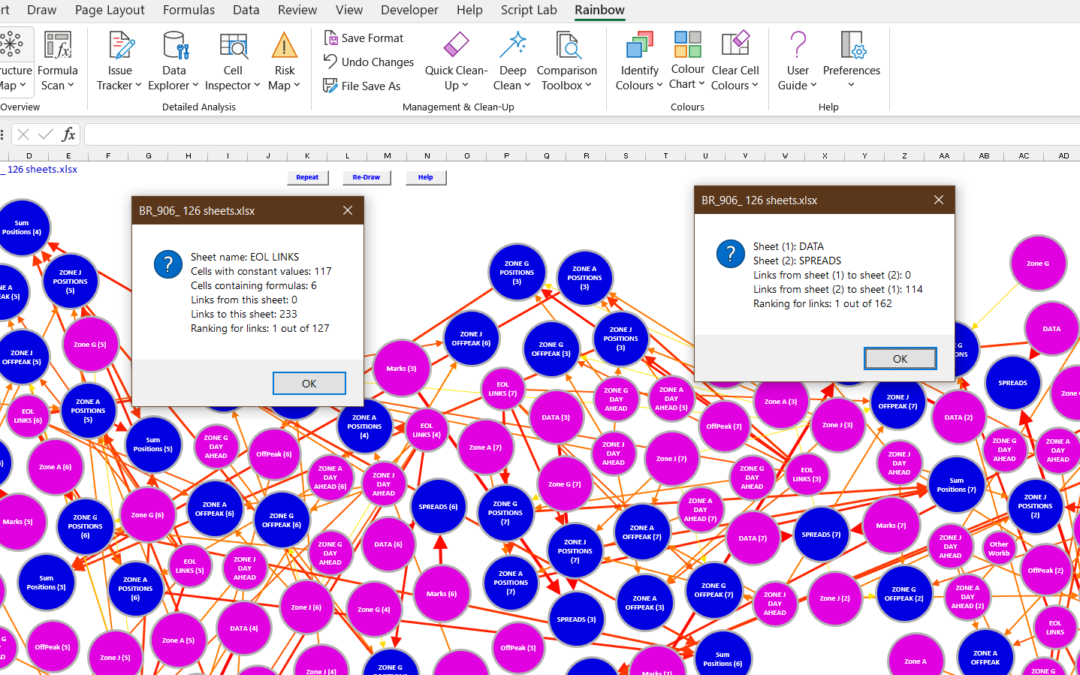
We’re very pleased with our new Structure Map function (see previous post) and its ability to visualise how a spreadsheet operates. But we didn’t discover till later that it was going to have problems with really big workbooks. So in Rainbow version 12.5.2 we’ve now revised and optimised our algorithm to handle very large numbers of worksheets, as you can see in the composite screenshot above.
This shows a workbook with 126 sheets (or 127 if you include the notional “Other workbooks” sheet). A workbook of this size is bound to be confusing, but you can see how our algorithm has tried to pull together the sheets that are most closely connected, e.g. DATA and SPREADS. And the revised algorithm now runs considerably faster than the original version.
It also gives you greater control over the finished layout. If you click Preferences (on the Rainbow tab), you can adjust two parameters for Attraction and Separation. With these you can choose a layout that is small and neat, but may be hard to understand. Or you can select a more widely-spaced and irregular layout that may show the workbook structure more clearly. Why not update to the latest version of Rainbow and experiment with it for yourself?
If you haven’t yet started using Rainbow Analyst, maybe you’d like to get an overview of what it does. So we’ve just added an Overview page to our website, which does exactly “what it says on the tin”. It gives you a brief summary (and a screenshot) of each of Rainbow’s main functions, and a one-line description of the subsidiary functions. We hope you find it helpful!